SignalEdgeX
Engine ActivityDemo
XAU/USD· New opportunity detected
EUR/USD· Signal validation complete
US100· Analysis in progress
WTI· Bullish setup identified
GBP/USD· Risk profile assessed
USD/JPY· Scenario ready to simulate

Stop Guessing.Start Trading Smarter.

HOW IT WORKS
01

Risk management.

Your capital. Your leverage. Your risk.

YOUR TRADING PROFILE Personalised
Maximum risk per trade$20

Illustrative sizing · explore your own parameters

02

See the opportunity clearly.

Tap or scroll on the card to explore.

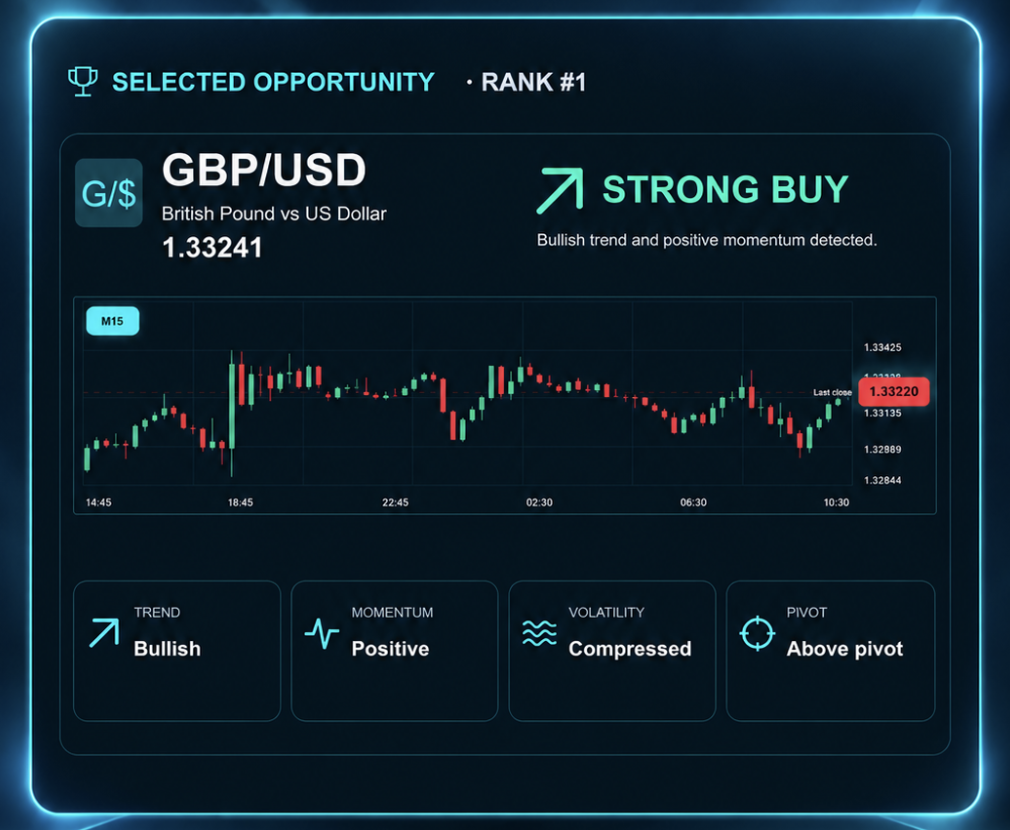
Discover: selected GBP/USD opportunity, rank 1, strong buy, M15 candlestick chart and market context.
01 / 04

Find your next opportunity.

Scan multiple markets for a clear trading setup.

Free DEMO: analysis + Outcome

Open Your Free Demo Account

Start with DEMO access. Simulator X and MT5 Executor require activation.

How It Works

Two Steps to Smarter Trading.

Set your capital, leverage and risk. Then discover, validate, analyse and simulate
the best opportunities — all in one place.

STEP 01

Set Your Capital. We Handle the Numbers.

You choose how much to trade, the leverage and your risk limit.

You can change these values anytime in your account settings.

Calculated Results

Recommended Volume0.50 lots
Required Margin$ 237
Potential Loss (2%)$ 200
Estimated Margin Level4219%
Potential Profit (TP1)$ 625
Risk / Reward1 : 3.1

Based on an illustrative scenario and selected settings.

STEP 02

From Market Opportunity to Your Trade.

A clear process, from data to simulated decision and real execution.

  1. DISCOVER

    Discover Opportunity

    Find high-probability trading opportunities across multiple markets, updated in real time.

    • Real-time market scanning
    • Multiple assets
    • Clear trade setups
    • Easy to understand
  2. VALIDATE

    Validate Opportunity

    Don’t rely on a single signal.
    We run multiple checks to confirm
    each setup.

    • Technical consensus
    • Market context
    • Signal engine
    • Pivot analysis
    • Trade validation
  3. OUTCOME

    Engine X Outcome

    See the plan with entry, stop loss
    and take profit levels before you trade.

    • Clear entry, stop loss and take profit
    • Potential profit and maximum loss
    • Risk / reward ratio
    • Confidence level
    • Real-time market conditions
  4. SIMULATOR & EXECUTION

    MT5 Execution /
    Simulator X

    Execute your trade in real time with one click
    in your connected MT5 account.
    Or test it first in Simulator X.

    • Execute in MT5 (real account)
    • Simulate trade in SignalEdgeX
    • Recommended position size
    • See potential results (TP1/TP2, SL)
    • Trade with confidence
Open Your Free Demo Account

Start with DEMO access. Simulator X and MT5 Executor require activation.

THE SIGNAL CHECKLIST

One Opportunity.
Five Powerful Checks.

A clearer view, one check at a time.

THE SIGNAL CHECKLIST

Technical Consensus

5/6
TECHNICAL ALIGNMENTEUR/USD M15Five indicators point higher.
EMA 50 / 200
BULLISH
RSI 14
BULLISH
MACD
BULLISH
Stochastic
BULLISH
Bollinger Bands
NEUTRAL
ADX 14
BULLISH
STRONG BUY5 of 6 indicators aligned

Six indicators. One direction.

Trend, momentum and strength in one clear view.

Illustrative examples · No live data or trading actions.

One Opportunity. Five Powerful Checks.

1 / 5 · Technical Consensus
TECHNICAL CONSENSUS

Different Indicators.
One Market Direction.

SignalEdgeX combines multiple technical indicators
to assess trend, momentum, and market structure,
helping you see the bigger picture.

Multiple indicators, one view

Looks at key technical factors, not a single signal.

Clear market direction

Helps identify the strength and direction of the move.

More consistent opportunities

Filters out weaker setups for higher quality signals.

Live Indicator Analysis

EURUSD.M15
EMA (50/200)
BULLISHTrend aligned
RSI (14)
BULLISHMomentum strong
MACD (12,26,9)
BULLISHPositive momentum
Stochastic (14,3,3)
BULLISHUptrend confirmed
Bollinger Bands
BULLISHPrice near upper band
ADX (14)
BULLISHStrong trend

Technical Consensus

5 of 6 indicators are in agreement.

STRONG BUY
MACRO INTELLIGENCE X

Market Events.
Clearer Context.

Track the economic releases that shape market conditions. Review timing, impact, and expectations before considering your next setup.

Important events, in view

See upcoming releases alongside their expected impact.

Understand the market context

Compare previous readings with market expectations.

Prepare before the release

Keep important event windows in your trading plan.

Economic Calendar

Next 24 hours
Time (UTC)CurrencyEventImpact
USDCore CPI m/mHIGH
GBPBoE Interest Rate DecisionHigh
USDUnemployment ClaimsMedium
EURECB Press ConferenceHigh
USDFed Member SpeaksMedium
DEMONSTRATION DATA · UTC
GENERATOR X

Opportunities Don't
Appear by Accident.

Generator X scans market structure for a Bullish Pullback, then checks M15, H1 and H4 before building a trade plan.

Structured market analysis

Finds structure and a defined pullback zone.

Multiple timeframes

Checks alignment across M15, H1 and H4.

Consistent and objective

Builds a clear plan for further validation.

XAUUSDM15

Generator X

  1. 1Market Scanning
  2. 2Setup Detected
  3. 3Multi-Timeframe Confirmation
  4. 4Trade Plan
4,2404,2204,2004,1804,1604,1404,120BULLISH PULLBACK DETECTEDTP2 4,235TP1 4,200Entry 4,165SL 4,130ANALYZING MARKET STRUCTUREScanning for a structured setup...06:0009:0012:0015:0018:0021:00ILLUSTRATIVE DATA · NOT A LIVE SIGNAL
TRADE PLAN · DEMONSTRATION
DirectionBUY
Entry4,165
Stop Loss4,130
TP14,200
TP24,235

MULTI-TIMEFRAME CONFIRMATION · DEMO

M15Setup detected
H1Trend aligned
H4Structure confirmed
PIVOT

Key Price Levels.
Stronger Decisions.

Pivot identifies important support and resistance levels, helping you understand where price stands within the current market structure.

Clear Market Structure

Identify important support and resistance levels.

Multiple Timeframes

Understand price positioning across different timeframes.

Better Trade Positioning

See relevant price levels before evaluating a potential entry.

iAdditional market context before the next validation step.

EURUSDH1
Pivot Levels
1.09801.09601.09401.09201.09001.0880S2 1.0889S1 1.0906P 1.0932R1 1.0958R2 1.09751.0948Price approachingR1 resistance12:0018:0012 May06:0012:0018:00

PIVOT ANALYSIS

Current Price1.0948
Pivot (P)1.0932
Resistance 1 (R1)1.0958
Resistance 2 (R2)1.0975
Support 1 (S1)1.0906
Support 2 (S2)1.0889

MARKET CONTEXT

✓
Price above Pivot (P)Bullish context
✓
S1 holdingSupport intact
✓
Approaching R10.0010 below resistance

Illustrative market context · Demonstration data only

VALIDATOR

Higher Confidence.
Smarter Entries.

Validator performs an additional assessment of the opportunity, helping you understand whether market conditions support the proposed entry.

Comprehensive Validation

Multiple conditions assessed before the next step.

Clear and Transparent

See the checks supporting the validation result.

More Informed Decisions

Additional confirmation before simulation or execution.

iValidation provides additional market context. It does not guarantee trading results.

XAUUSDM15
Validator Analysis i

VALIDATION CHECKS · DEMO

1. Trend Alignment

M15, H1 and H4 aligned in this demo.

CHECKING
2. Key Levels

Illustrative support/resistance context.

CHECKING
3. Indicator Confirmation

Illustrative indicator agreement.

CHECKING
4. Risk Parameters

SL < Entry < TP1 < TP2.

CHECKING
5. Market Structure

Coherent illustrative setup structure.

CHECKING
4,2404,2204,2004,1804,1604,1404,120TP2 4,235TP1 4,200Entry 4,165SL 4,13006:0012:0018:0013 May

Demonstration data · Visual labels only

Scroll to explore all five engines ↓

Illustrative demonstrations only. No live market data or trading actions.

SMART TRADE MANAGEMENT

Hit TP1.
Protect your profit.

At TP1, your Stop Loss moves to TP1.
Keep the trade open toward TP2.

EUR/USDBUY M15 · Illustrative setup
Price moves. The plan stays clear.Pullbacks and consolidation before TP1.
TP1 reached. Stop Loss moves up.The new Stop Loss sits exactly at TP1.
Protected at TP1. Aiming for TP2.Price continues with smaller pullbacks.
  1. 01Reach TP1
  2. 02Move Stop Loss
  3. 03Aim for TP2

Illustrative price path · No live orders.

SMART TRADE MANAGEMENT

HIT TP1.PROTECT YOURPROFIT.

When TP1 is reached,
your Stop Loss moves to TP1 —
letting your trade continue toward TP2.

  1. 01

    Reach TP1

    Price hits your first target.

  2. 02

    Lock In Profit

    Stop Loss moves to TP1 automatically.

  3. 03

    Aim for TP2

    Your trade continues toward a bigger gain.

FROM OUTCOME TO EXECUTION

Validate. Simulate.
Execute.

Turn market opportunities into real trades — with clear risk, real data and direct execution in your MT5 account.
01 VALIDATE

Know your trade.

See entry, Stop Loss and targets before you decide.
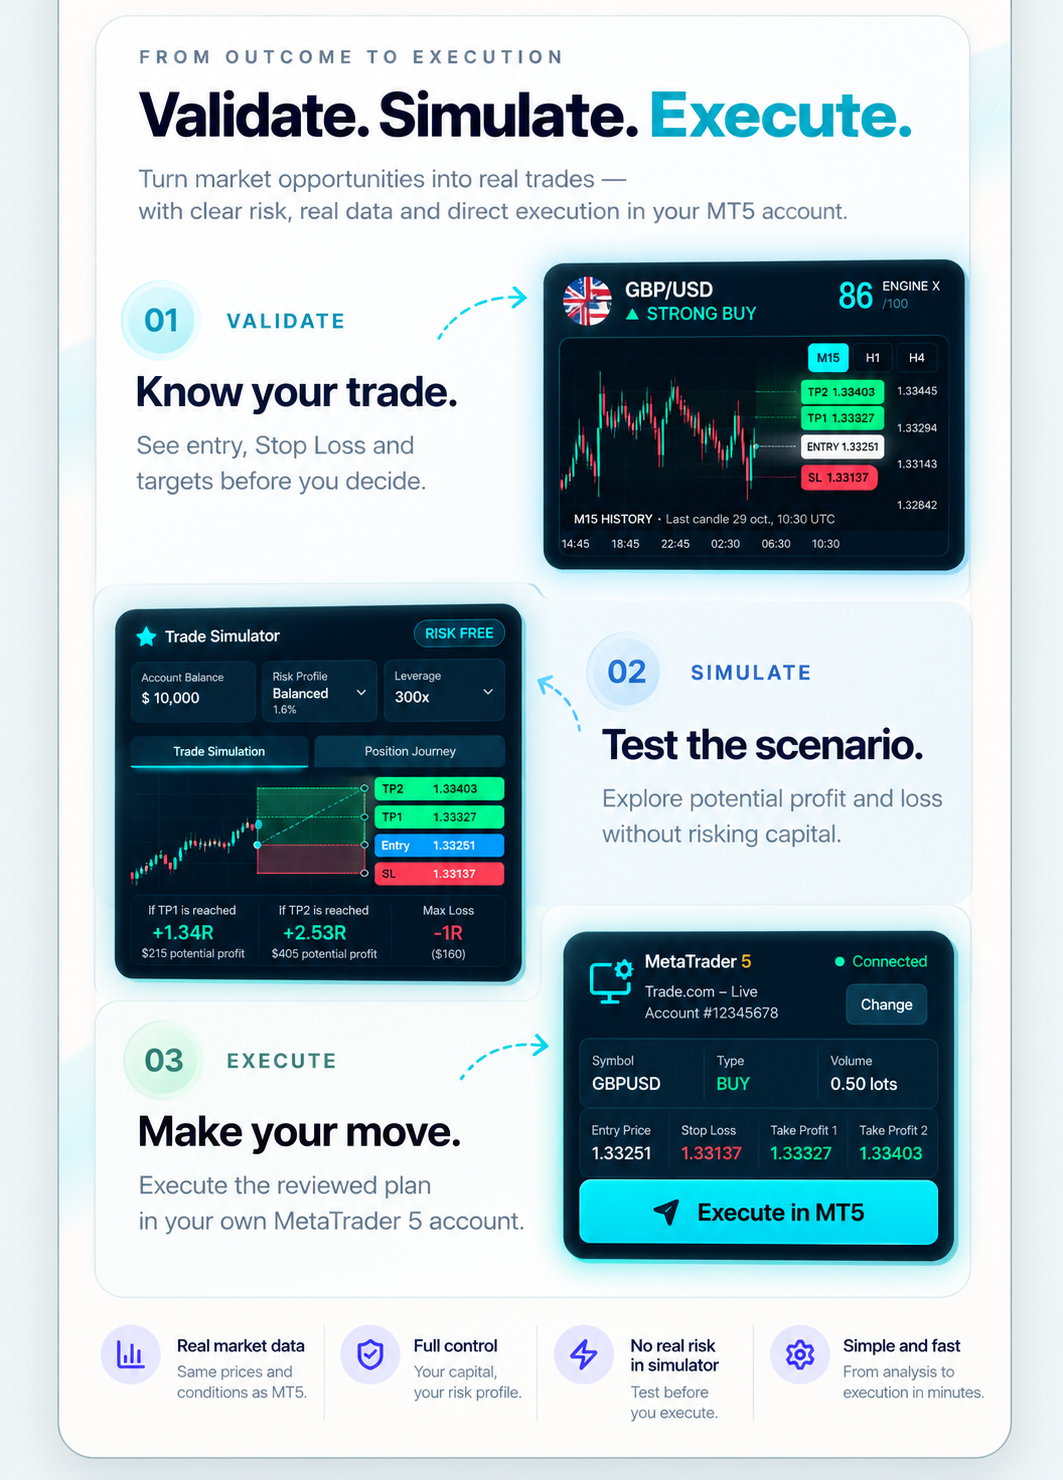
Approved GBP/USD trade plan with entry, Stop Loss and targets.
Approved Trade Simulator showing potential profit and maximum loss.
02 SIMULATE

Test the scenario.

Explore potential profit and loss without risking capital.

03 EXECUTE

Make your move.

Execute the reviewed plan in your own MetaTrader 5 account.

Approved MetaTrader 5 execution illustration. No interactive order control.

Illustrative screens · No live connection or orders.

Real market dataSame prices and conditions as MT5.
Full controlYour capital, your risk profile.
No real risk in simulatorTest before you execute.
Simple and fastFrom analysis to execution in minutes.

FROM OUTCOME TO EXECUTION

Validate. Simulate. Execute.

Turn market opportunities into real trades —
with clear risk, real data and direct execution in your MT5 account.

1

OUTCOME

Know exactly what you’re trading.

EURUSD.M15Updated 3 min ago
STRONG BUY
Entry1.0942
SL1.0910
TP11.0985
TP21.1023
Risk / Reward1 : 2.53
Potential Profit+2.53R
Potential Loss−1R
2

SIMULATOR X

See how it could perform.

✦ Trade Simulator

RISK FREE
Account Balance$ 10,000
Risk ProfileBalanced Illustrative 1.6%
Leverage300x
Recommended Volume 0.50 lots

Based on 1.6% risk
(Max risk: $160)

Trade SimulationPosition Journey
TP21.1023TP11.0985Entry1.0942SL1.0910
If TP1 is reached+1.34R$215 potential profit
If TP2 is reached+2.53R$405 potential profit
Max Loss−1R($160)

After TP1, move Stop Loss to TP1.Lock in profit and let the trade run to TP2.

3

EXECUTE IN MT5

Go live in your own account.

SymbolEURUSD.
TypeBUY
Volume0.50 lots
Entry Price1.0942
Stop Loss1.0910
Take Profit 11.0985
Take Profit 21.1023
Execution Settings

Real market data

Same prices and conditions as MetaTrader 5.

Full control

Your capital, your risk profile, your broker account.

No real risk in simulator

Test the opportunity before you execute.

Simple and fast

From analysis to execution in minutes.

Explore SignalEdgeX for Free

Start with DEMO access. Simulator X and MT5 Executor require activation.

Illustrative data. No live connection or trading action.

SIGNAL PERFORMANCE

Cumulative results

Observed Signals.
Transparent Results.

One cumulative record of evaluated signals. Historical results are modelled and not independently certified; future monitored results are added only after evidence and metric compatibility checks. Results do not establish real trade executions.

Selected Opportunities

5,395

Strict first-pass opportunities; exclusions shown below.

Observed Tick Terminals

4,793

Observed terminals with requested intervals covered; uncertified.

TP1 Before SL

71.15%

Of observed tick terminals reached TP1 before SL.

SL Before TP1

28.85%

Of evaluated opportunities hit Stop Loss before reaching TP1.

DISTRIBUTION OF EVALUATED OUTCOMES

Total Evaluated: 4,793
67.62%28.85%4,793EvaluatedOpportunities
Stop Profit67.62%3,241
TP23.53%169
SL Before TP128.85%1,383

EXPLORE PERFORMANCE BY MARKET

ALL MARKETS (Cumulative results)

5,395Opportunities
Tracked
4,793Evaluated
Outcomes
71.15%TP1 Before
SL
28.85%SL Before
TP1

Transparent Results. Clear Methodology.

Every result is measured against predefined price levels, with excluded observations disclosed separately.

Defined evaluation rules
(price-level evaluation)
Data gaps
disclosed (128)
Available evaluation evidence
and methodology

5,395 selected = 4,793 observed tick terminals + 602 excluded from terminal percentages: 128 incomplete requested intervals, 21 open, 453 without entry. 1,040 terminals have tick gaps >60s; retained and uncertified, not automatically losses.

Methodology & full research results

Download cumulative aggregate and source provenance

Source: archived strict D3 qualification export, cohorta-replay.csv and Raport-D3-integral.txt, reconciled by original source SHA-256 and exact selected IDs. 5,395 selected; legacy M15 snapshot reproduced: 4,040 clear terminals, 1,348 SL-before-TP1, 2,692 TP1-before-SL. These are separate method views of the same historical IDs, never added together.

Tick model: first qualification C PASS + Generator TRADEABLE + (Pivot CLEAR or Validator ENTRY_CONFIRMED), within one hour of decision close. SL = 3.4 ATR. BUY uses BID; SELL uses actual historical ASK. Entry anchors qualification. TP1 activates a virtual stop at TP1; subsequent return gives Stop Profit, or TP2 terminates first. All fills are ideal at thresholds; no broker execution, fees, slippage or net returns verified.

Requested interval coverage is not feed exhaustiveness. utc_alignment_certified=false; coverage_certified=false; independently certified=0. The 1,040 terminal paths with gaps over 60 seconds remain disclosed, uncertified. No ROI, RR or trading win rate is published.

Snapshot cutoff: 23 Oct 2026 13:57:27 UTC. Tick replay cutoff exclusive: 23 Oct 2026 13:45:00, raw epoch represented as UTC, absolute alignment unverified. No observations after these cutoffs are implied by the cumulative label.

New monitored results enter this same cumulative record only after original live plans, complete BID/ASK evidence, matching ACK, immutable ID reconciliation and equivalent selection, entry, target, stop and terminal-denominator rules have been reviewed. An ACK is not evidence of a real trade execution. Source, cohort, cutoff and quality remain in the internal audit trail; historical IDs and duplicate IDs cannot be counted again. Incompatible metrics are withheld. No monitored results have been admitted yet.

Verified monitored results are published daily. The existing schedule is retained: first 27 October 2026 at 00:01 Europe/Chisinau, then daily at 00:01. Scheduled refresh alone does not admit or certify results.

Complete instrument accounting · Cumulative results · all counts from the published snapshot
InstrumentTrackedEvaluatedStop ProfitTP2SL before TP1Data gapsTick gaps >60sOpenMissing entry
AUDUSD5174252892111514130375
EURUSD484441256291565144038
GBPUSD471418290221061992034
NZDUSD46638023191401189174
US10053650037712111383627
US304974633319123662028
USDCAD4934313061710813106148
USDCHF47139324751413795140
USDJPY48344628616144096136
WTIUSD456401256121332050035
XAUUSD52149537217106093818

Cumulative record · evidence cutoffs and evaluation rules available in Methodology.

Historical tick-based reconstruction / modelled, not independently certified. Ideal fills; no verified execution. Target touches do not establish profit. No performance promises. CFDs carry a high risk of losing money.

MARKETS

One Platform. Multiple Markets.

Trade global opportunities across the world’s most popular markets,
with the same workflow and risk management.

Forex

Major, minor and exotic currency pairs.

Commodities

Gold, silver, oil and other key commodities.

Indices

Global equity indices.

Crypto

Leading cryptocurrencies.

A CLEARER WAY TO TRADE

Multiple Checks. One Clear Decision.

SignalEdgeX brings everything together in a simple workflow,
so you can understand the opportunity and act with confidence.

Understand What Supports Every Opportunity.

Multiple checks across technical analysis, market context and our signal engine.

Know Your Risk Before You Trade.

See potential profit, maximum loss, risk / reward and recommended position size.

From Insight to Execution.

Move from validated opportunities to real-time MT5 execution or test them in our simulator.

ABOUT SIGNALEDGEX

Why we created
SignalEdgeX

Trading platforms provide charts, indicators and market data. Signal providers tell you when to buy or sell. But understanding whether an opportunity is worth taking often requires switching between several tools and making sense of different information.

SignalEdgeX was created to make this process simpler.

The idea is to bring the important steps together in one place: find potential trading opportunities, check them using different methods, see the possible profit and loss, and test a trade before deciding whether to execute it in MetaTrader 5.

We don't believe any application can predict the market or eliminate trading risk. Our goal is simply to give traders more useful information and practical tools to help them make their own decisions.

ABOUT SIGNALEDGEX

Why we created
SignalEdgeX

SignalEdgeX was created to make trading decisions clearer. We bring market analysis, risk and trade planning into one place, so you can understand an opportunity before deciding what to do.

Review the setup, explore the possible outcomes and choose your next move. Your capital. Your decision.

FAQ

Common questions.

Quick answers to the most important things
you need to know about SignalEdgeX.